SINGAPORE INDUSTRIAL PROPERTY MARKET OVERVIEW
Northeast
North
West
East
Central
Single-User Factory
Business Park
Multi-User Factory
3.3 DEMAND AND OCCUPANCY
During 2014, the total quantum of occupied industrial stock rose by 3.7% YoY to 419.0 million sq ft as of 4Q 2014.
As the net new demand
13
of 14.8 million sq ft was less than the net new supply of 21.1 million sq ft in 2014, the
islandwide average occupancy rate of industrial space dipped from 91.9% as of 4Q 2013, to 90.9% as of 4Q 2014.
4.0 FACTORY MARKET OVERVIEW
4.1 SUPPLY OF FACTORY (INCLUDING BUSINESS PARK) SPACE
4.1.1 EXISTING SUPPLY
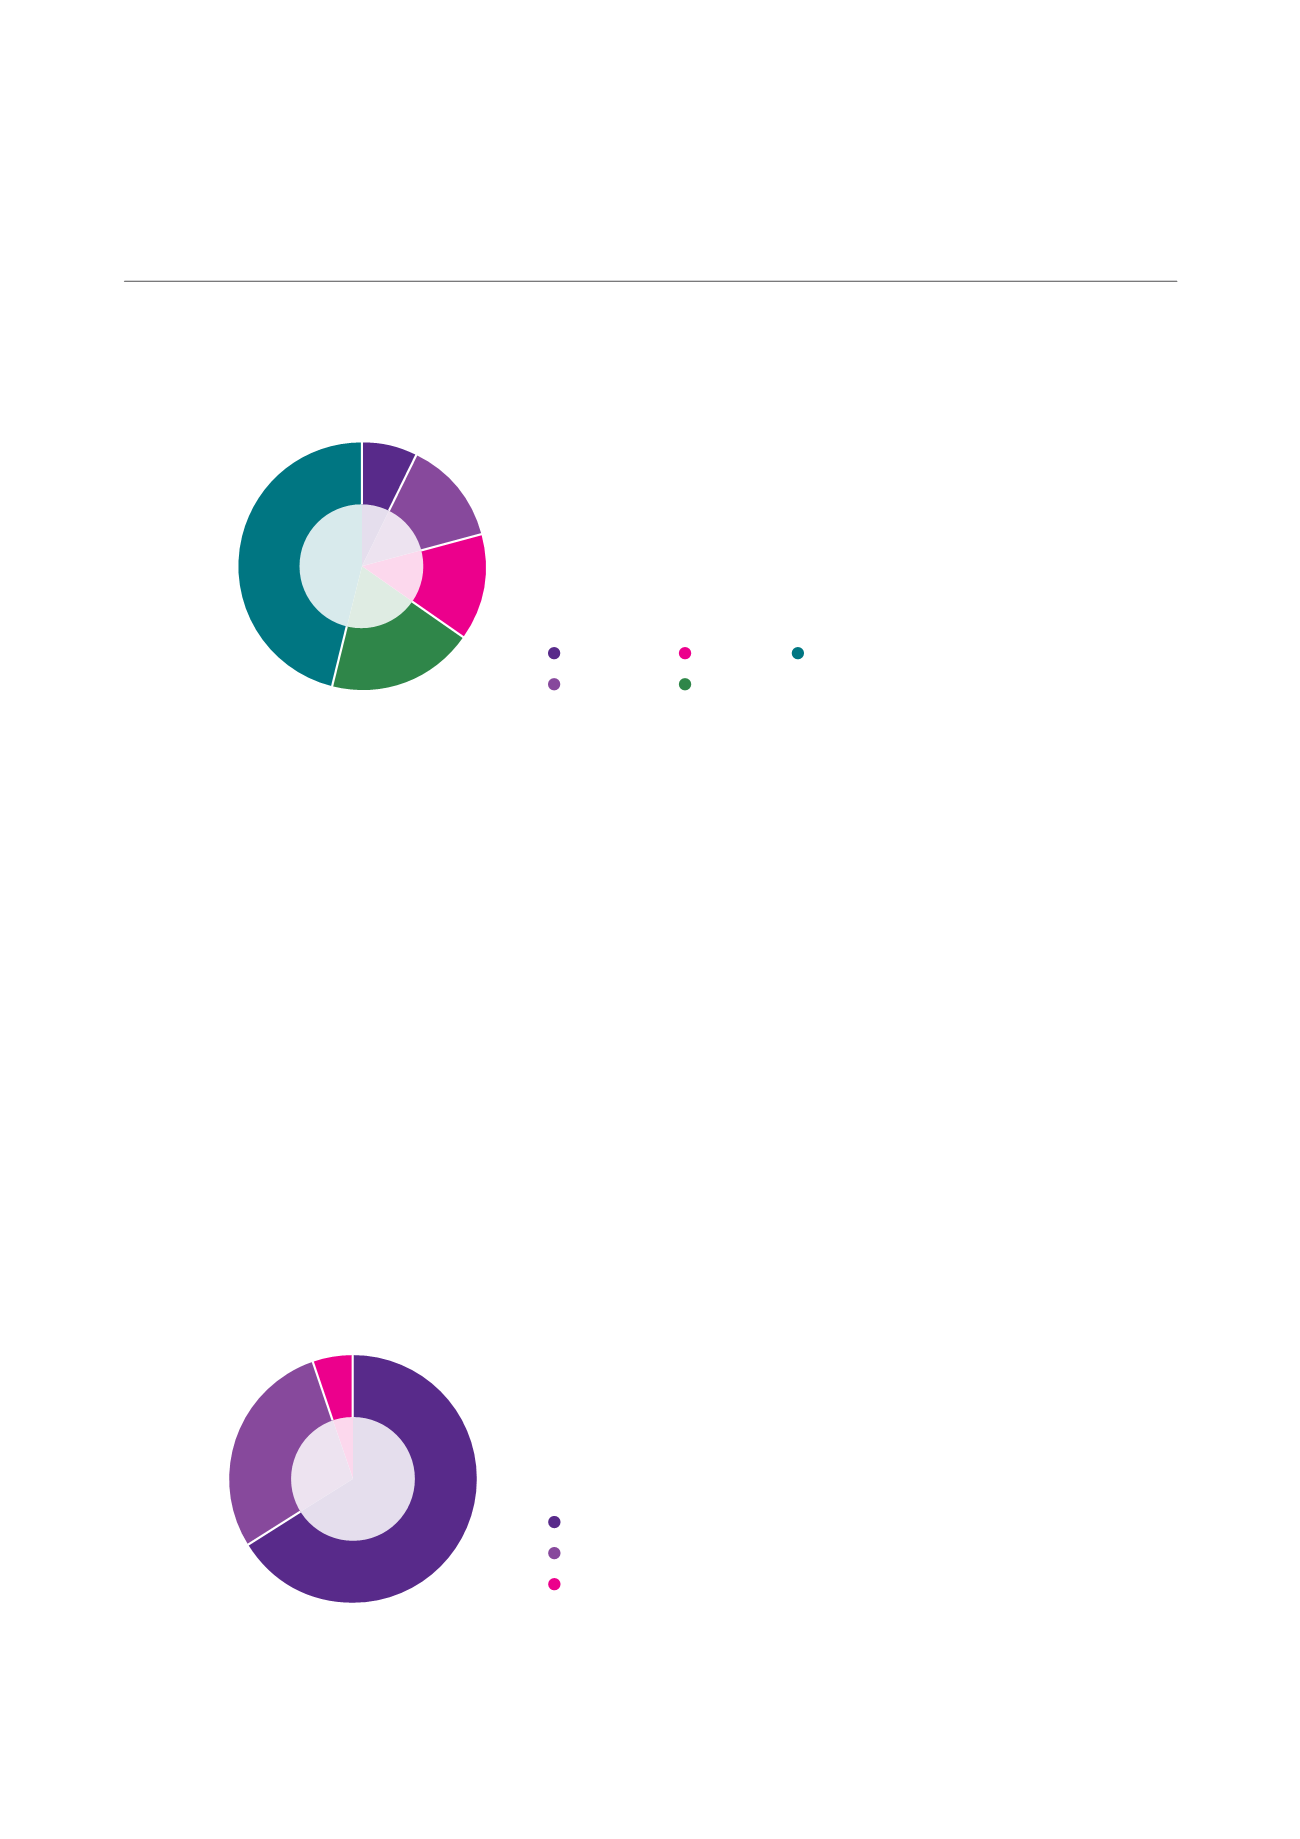
Singapore’s total factory stock (including business park space) of 370.6 million sq ft as of 4Q 2014, comprised
of 245.4 million sq ft (66.2%) of single-user factory space, 106.4 million sq ft (28.7%) of multi-user factory space
and 18.7 million sq ft (5.1%) of business park space.
BREAKDOWN OF TOTAL FACTORY STOCK
(AS OF 4Q 2014)
Source: JTC/Colliers International Singapore Research
Source: JTC/Colliers International Singapore Research
7.4%
13.5%
14.0%
19.1%
46.0%
13 Net demand refers to the net change in occupied space between two points in time.
66.2%
28.7%
5.1%
GEOGRAPHICAL DISTRIBUTION OF TOTAL INDUSTRIAL PROPERTY STOCK
(AS OF 4Q 2014)
CAMBRIDGE INDUSTRIAL TRUST | ANNUAL REPORT 2014
82


