SINGAPORE INDUSTRIAL PROPERTY MARKET OVERVIEW
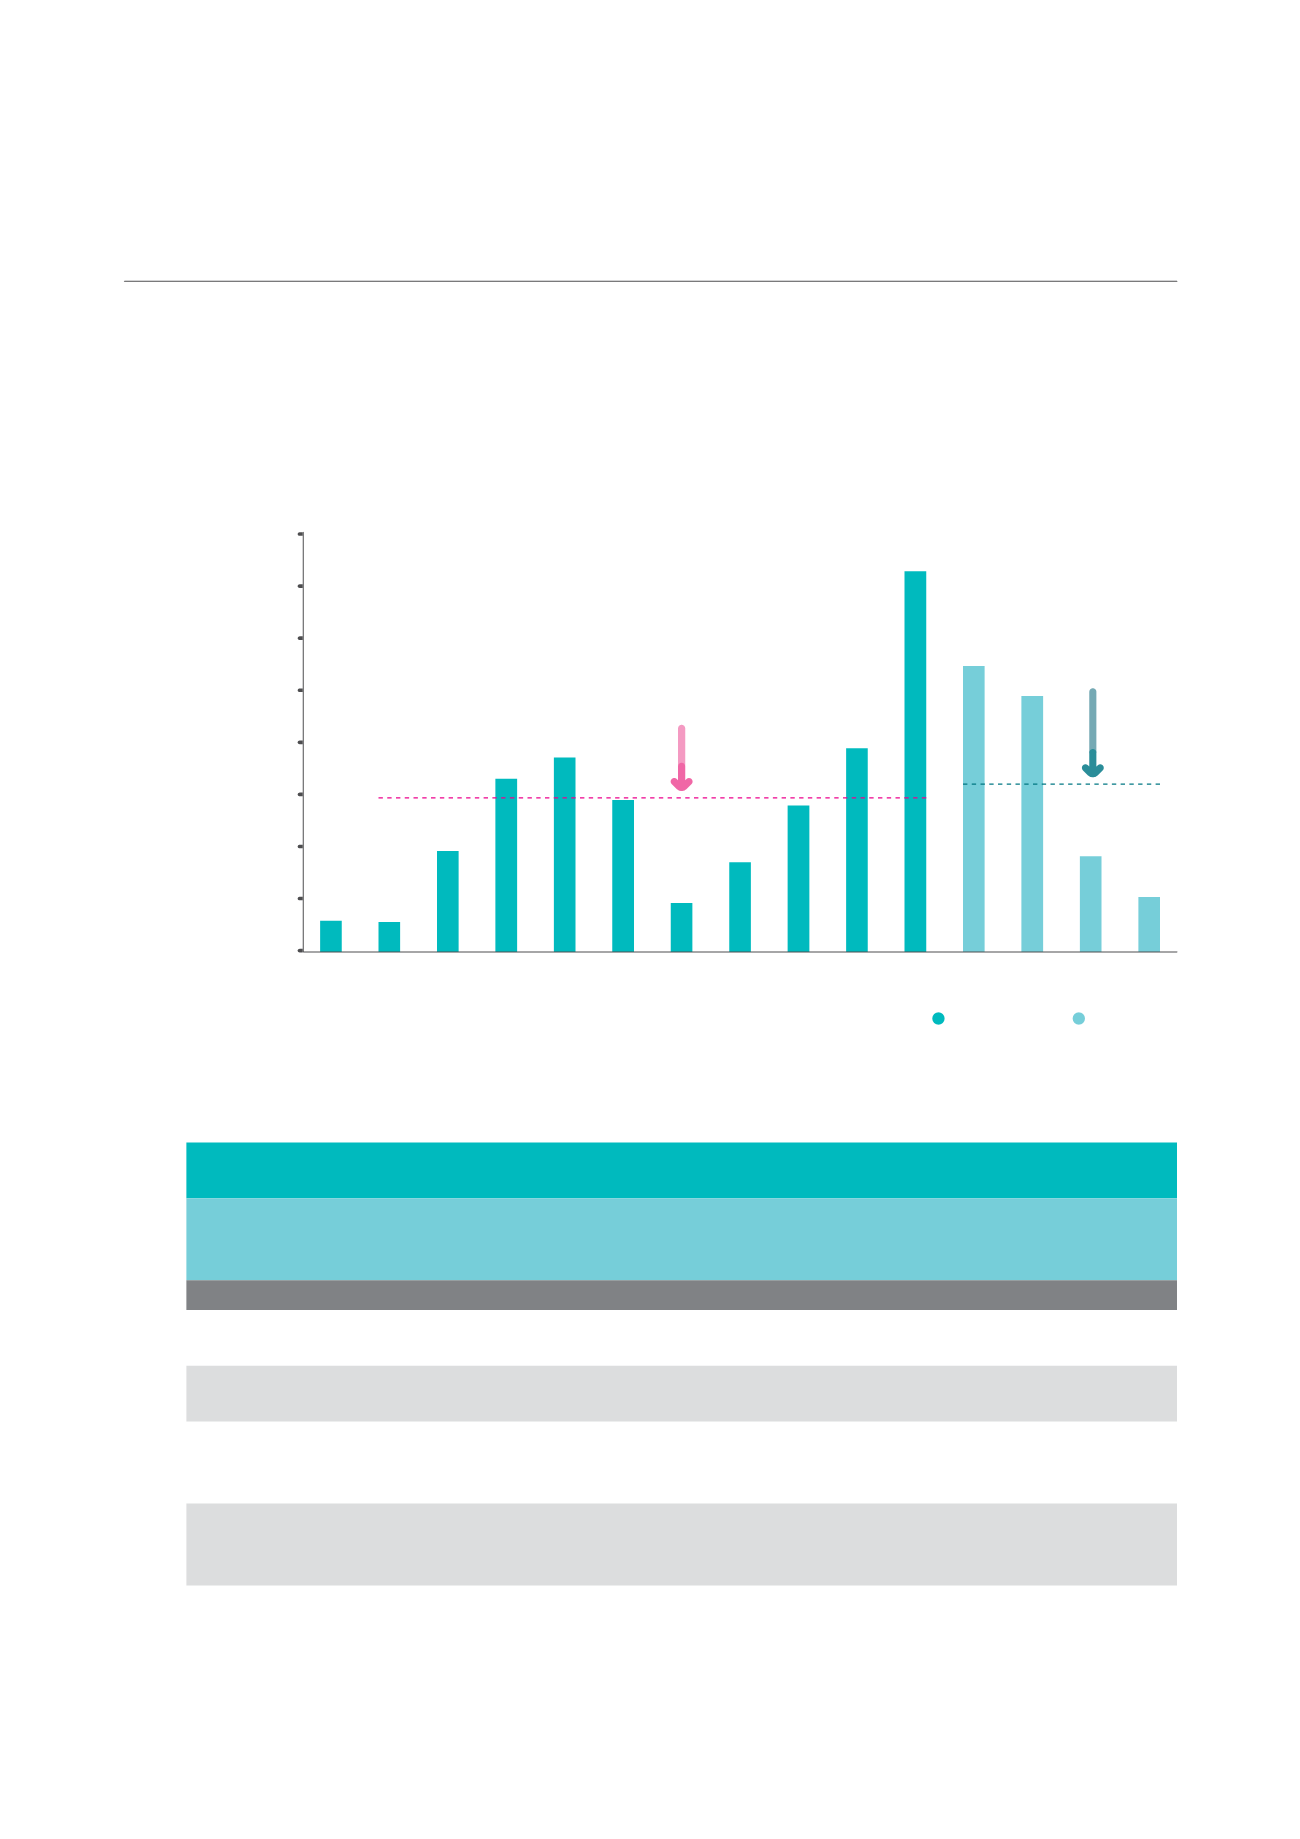
Based on Colliers International’s estimates, the majority 65.7% of the total pipeline warehouse supply is expected
to be located in the West planning region, followed by the East (20.1%), North (13.4%) and Northeast (0.9%)
planning regions.
NET NEW AND POTENTIAL SUPPLY OF WAREHOUSE SPACE
(As of 4Q 2014)
F: Forecast
Source: JTC/Colliers International Singapore Research
2004
2008
2006
2010
2012
2005
2009
2007
2011
2013 2014
2018F
2015F 2016F 2017F
8,000
7,000
6,000
5,000
4,000
3,000
2,000
1,000
0
Net Floor Area ('000 sq ft)
Completed
Upcoming
Examples of major upcoming warehouse projects from 2015 to 2018 are provided in the following table.
Examples of Major* Known Potential Supply of Warehouse Space from 2015 to 2018
(As of 4Q 2014)
Project Name
Location
Developer
Estimated
Net Lettable
Area (sq ft)
Expected Year
of Completion
(TOP)
Single-User Warehouse
CWT Pandan
Logistics Centre
Pandan Avenue
CWT Project Logistics
Pte Ltd
606,793
2015
Warehouse
Buroh Lane
Warehouse Logistics Net
Asia Pte Ltd
613,236
2015
Warehouse
Jurong West Street 22 Tech-Link Storage
Engineering
(For LF Logistics)
847,915
2015
DHL Supply Chain
Advanced Regional
Centre
Greenwich Drive
HSBC Institutional Trust
Services (S) Ltd for Cache
Logistics Trust
928,100
2015
Singapore
Post Regional
eCommerce
Logistics Hub
Greenwich Drive/
Tampines Road
Singapore Post Limited 518,546
2016
10-year Average Annual
Net New Supply of
2.9 million sq ft from
2005 to 2014
Average Annual
Potential New Supply
of 3.3 million sq ft
from 2015 to 2018
continue on next page
CAMBRIDGE INDUSTRIAL TRUST | ANNUAL REPORT 2014
92


