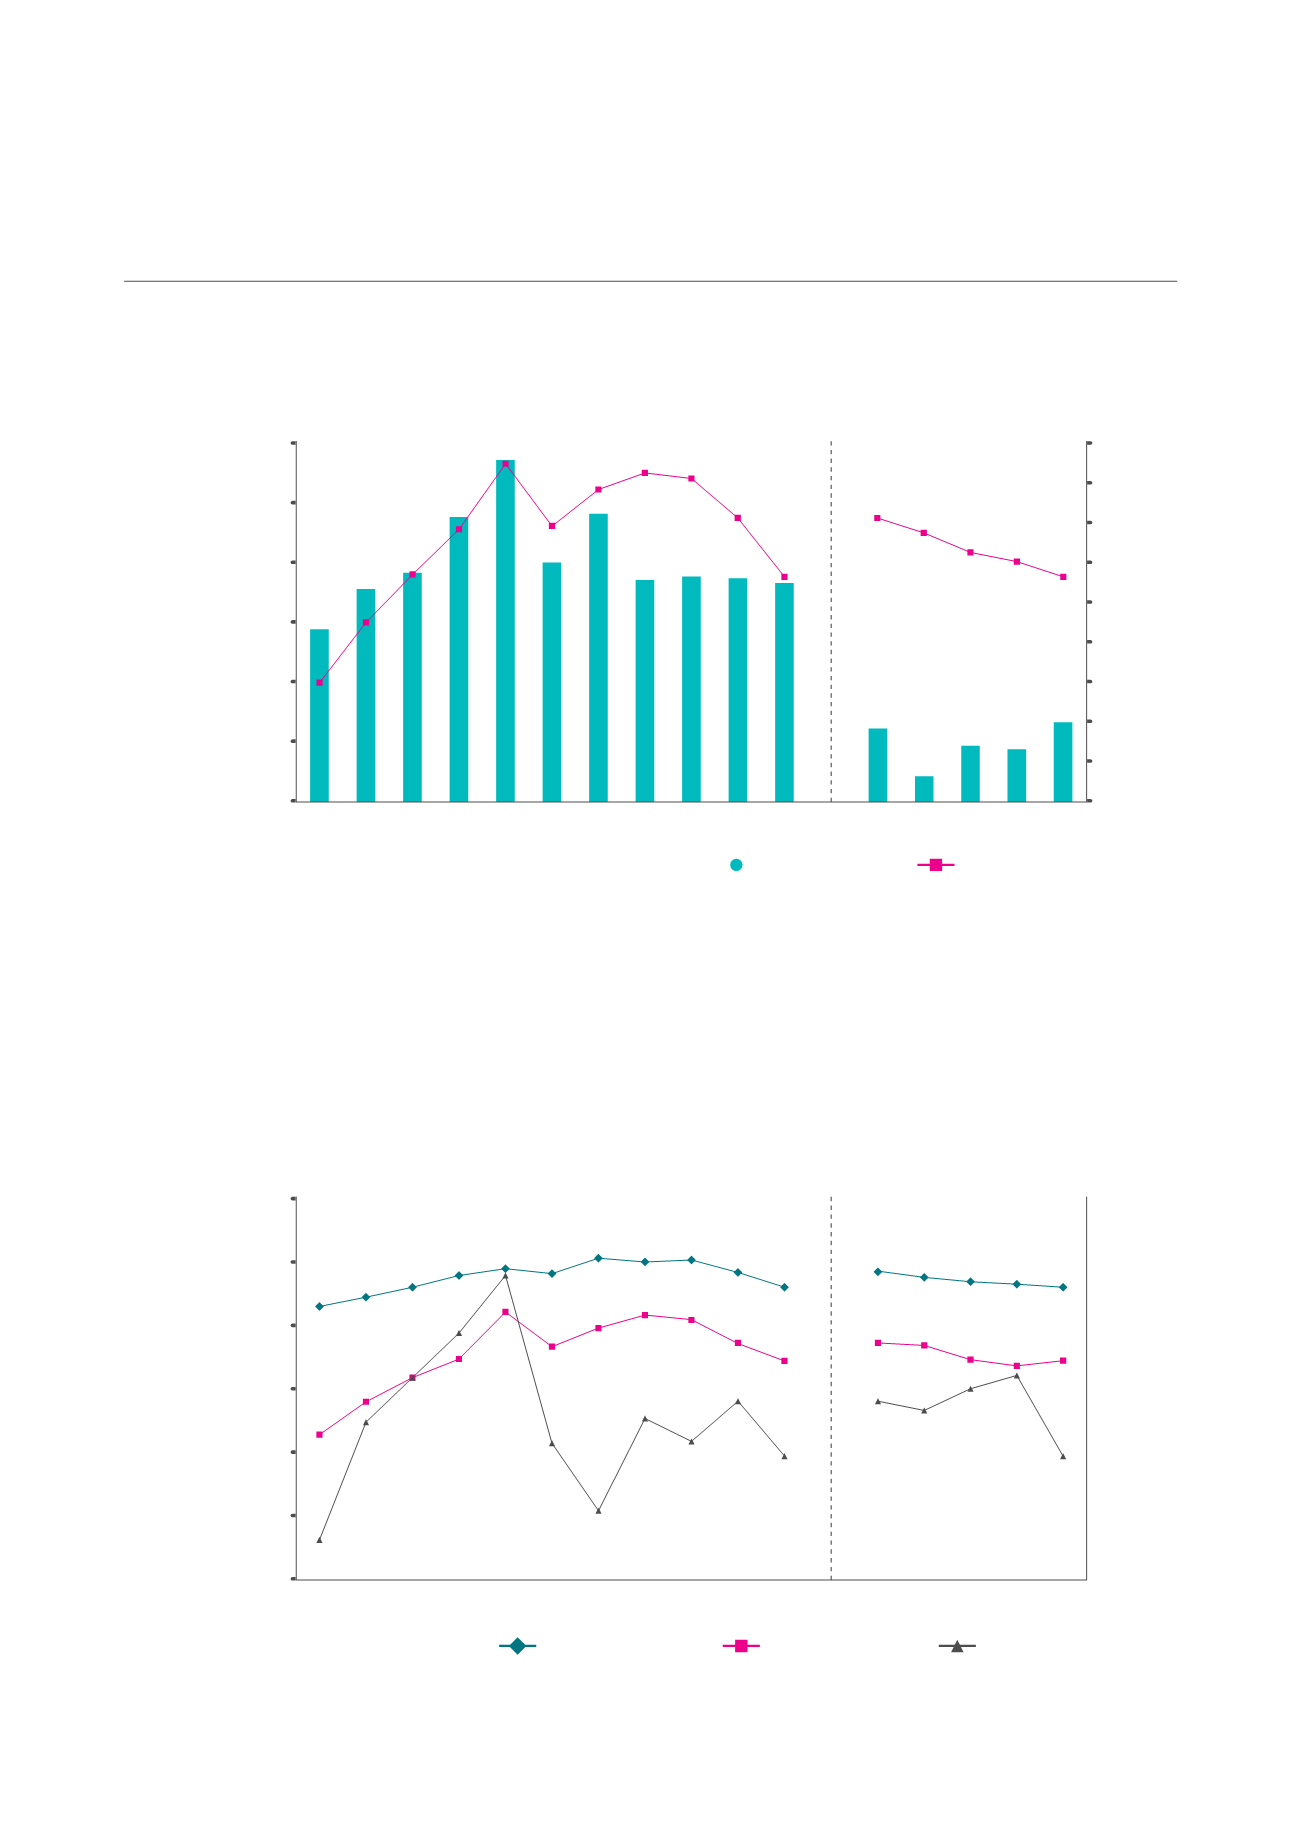
NET NEW DEMAND AND OCCUPANCY RATE OF FACTORY (INCLUDING BUSINESS PARK) SPACE
(AS OF 4Q 2014)
Specifically, the average occupancy rate of business park space recorded a 4.3 percentage points drop, from
84.1% as of 4Q 2013 to 79.8% as of 4Q 2014. This was due mainly to a time lag between project completion and
the physical occupation of the completed space in 4Q 2014. Over the same period, the average occupancy rate
of single-user factories eased 1.2 percentage points to 92.9% as of 4Q 2014, while the average occupancy rate
of multi-user factories slipped 1.4 percentage points to 87.2% as of 4Q 2014, as net new supply outstripped net
new demand for both segments in 2014.
AVERAGE OCCUPANCY RATES OF FACTORY SPACE (BY TYPES)
(AS OF 4Q 2014)
2004
2008
2006
2010
2012
2005
2009
2007
2011
2013 2014
4Q13 1Q14 2Q14 3Q14 4Q14
2,000
4,000
6,000
8,000
10,000
12,000
94%
93%
92%
91%
90%
89%
88%
87%
86%
85%
0
Net Floor Area ('000 sq ft)
Occupancy Rate
Source: JTC/Colliers International Singapore Research
Source: JTC/Colliers International Singapore Research
Net New Demand
Occupancy Rate
Multi-User Factory
Business Park
Single-User Factory
2004
2008
2006
2010
2012
2005
2009
2007
2011
2013 2014
4Q13 1Q14 2Q14 3Q14 4Q14
70%
75%
80%
85%
90%
95%
100%
Occupancy Rate
CAMBRIDGE INDUSTRIAL TRUST | A WINNING FORMULA
87


