Geographically, most (61.7%) of the warehouse stock was located in the West planning region, followed by the Central
(15.1%), East (14.2%), North (4.7%) and Northeast (4.3%) planning regions.
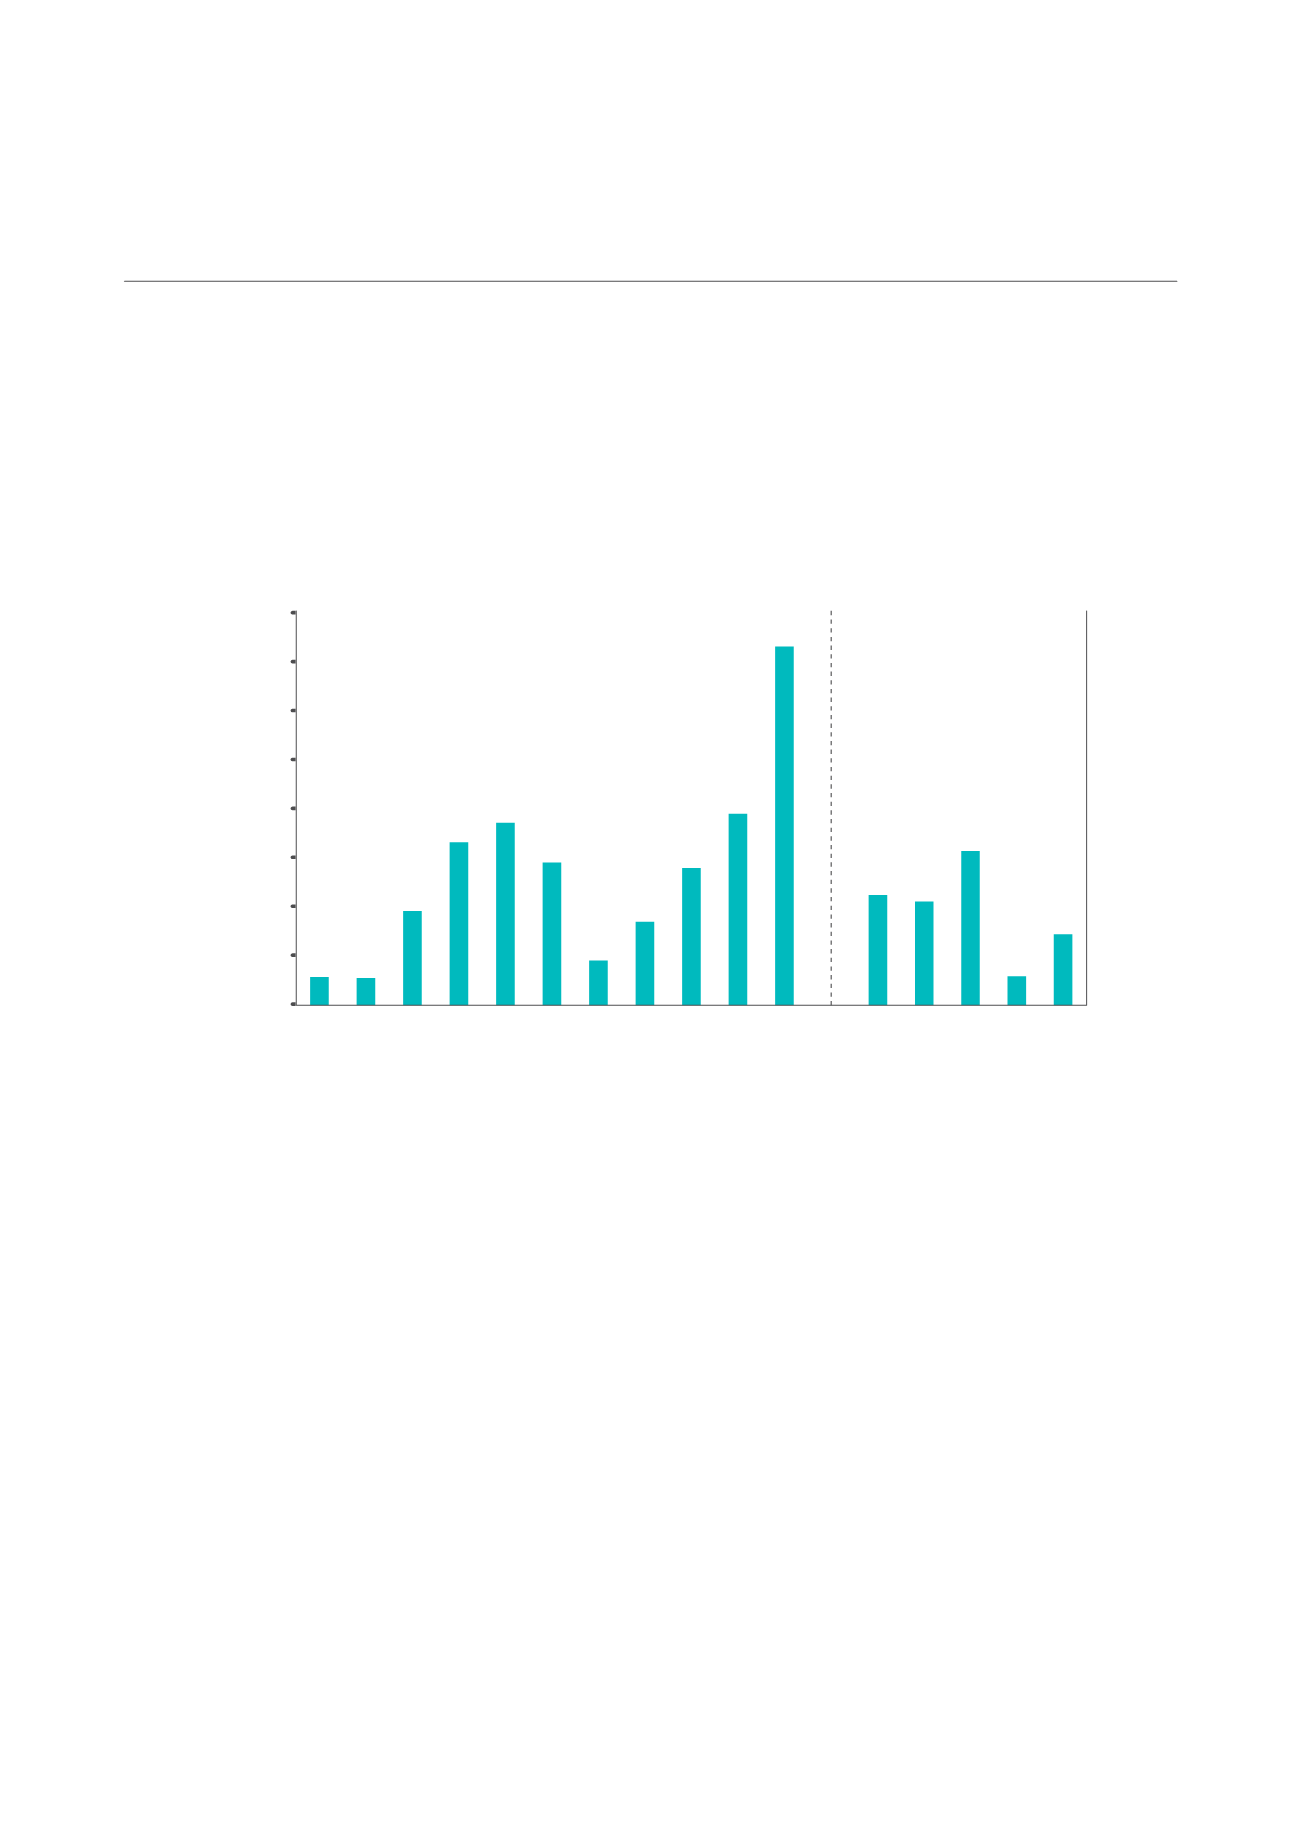
Compared to 2013, the islandwide warehouse stock has risen by 8.7% as of 4Q 2014. This followed a record net new
supply of 7.3 million sq ft of warehouse space in 2014, which was more than triple the annual average net new supply
of 2.2 million sq ft from 2004 to 2013, and 87.2% higher than the net new supply of 3.9 million sq ft achieved in 2013.
NET NEW SUPPLY OF WAREHOUSE SPACE
(As of 4Q 2014)
Major warehouses completed in 2014 include Cogent 1.Logistics Hub at Buroh Crescent (estimated NLA of about
1.5 million sq ft), Fairprice Hub at Joo Koon Circle (estimated NLA of about 957,000 sq ft), Big Box at Venture Avenue
(estimated NLA of about 952,000 sq ft), Singapore Wine Vault Building at Fishery Port Road (estimated NLA of about
710,000 sq ft) and CWT Jurong East Logistics Centre at Toh Guan Road East (estimated NLA of about 570,000 sq ft).
5.1.2 FUTURE SUPPLY
Based on available information as of 4Q 2014, a projected 13.2 million sq ft
18
(net floor area) of new warehouse
space is expected to be completed from 2015 to 2018.
The projected annual average supply of about 3.3 million sq ft from 2015 to 2018 is 13.8% higher than the 10-
year annual average net new supply of 2.9 million sq ft from 2005 to 2014. However, it is 15.4% lower than the
preceding four-year annual average net new supply of 3.9 million sq ft from 2011 to 2014.
This indicated an expected slowdown in new warehouse supply over the next few years. With the majority
73.5% of the total upcoming warehouse space expected to be single-user space that are likely to be almost fully
occupied upon completion, there is limited oversupply risk in the coming years.
Specifically, the supply of new warehouse space is expected to gradually taper off from about 5.5 million sq ft in
2015, to 4.9 million sq ft in 2016 and further to 1.8 million sq ft and 1.0 million sq ft in 2017 and 2018, respectively.
18 Potential supply includes space under construction and planned but the actual level of new supply could change due to changes in the status of
planned projects.
2004
2008
2006
2010
2012
2005
2009
2007
2011
2013 2014
4Q13 1Q14 2Q14 3Q14 4Q14
1,000
2,000
3,000
4,000
5,000
6,000
7,000
8,000
0
Net Floor Area ('000 sq ft)
Source: JTC/Colliers International Singapore Research
CAMBRIDGE INDUSTRIAL TRUST | A WINNING FORMULA
91


