14 Net new supply refers to new supply of space less stock withdrawals due to change of use, redevelopment and demolition. Where the space
withdrawn exceeds new additions, net new supply will be negative.
15 Potential supply includes space under construction and planned but the actual level of new supply could change due to changes in the status of
planned projects.
Source: JTC/Colliers International Singapore Research
This was distributed among theWest (42.2%), Central (20.0%), North (16.3%), East (13.3%) and Northeast (8.2%) planning
regions. Themajority 85.0%was owned by the private sector and the remaining 15.0%was owned by the public sector.
Compared to 4Q 2013, the overall stock of factory space (including business park) as of 4Q 2014 was 3.9%
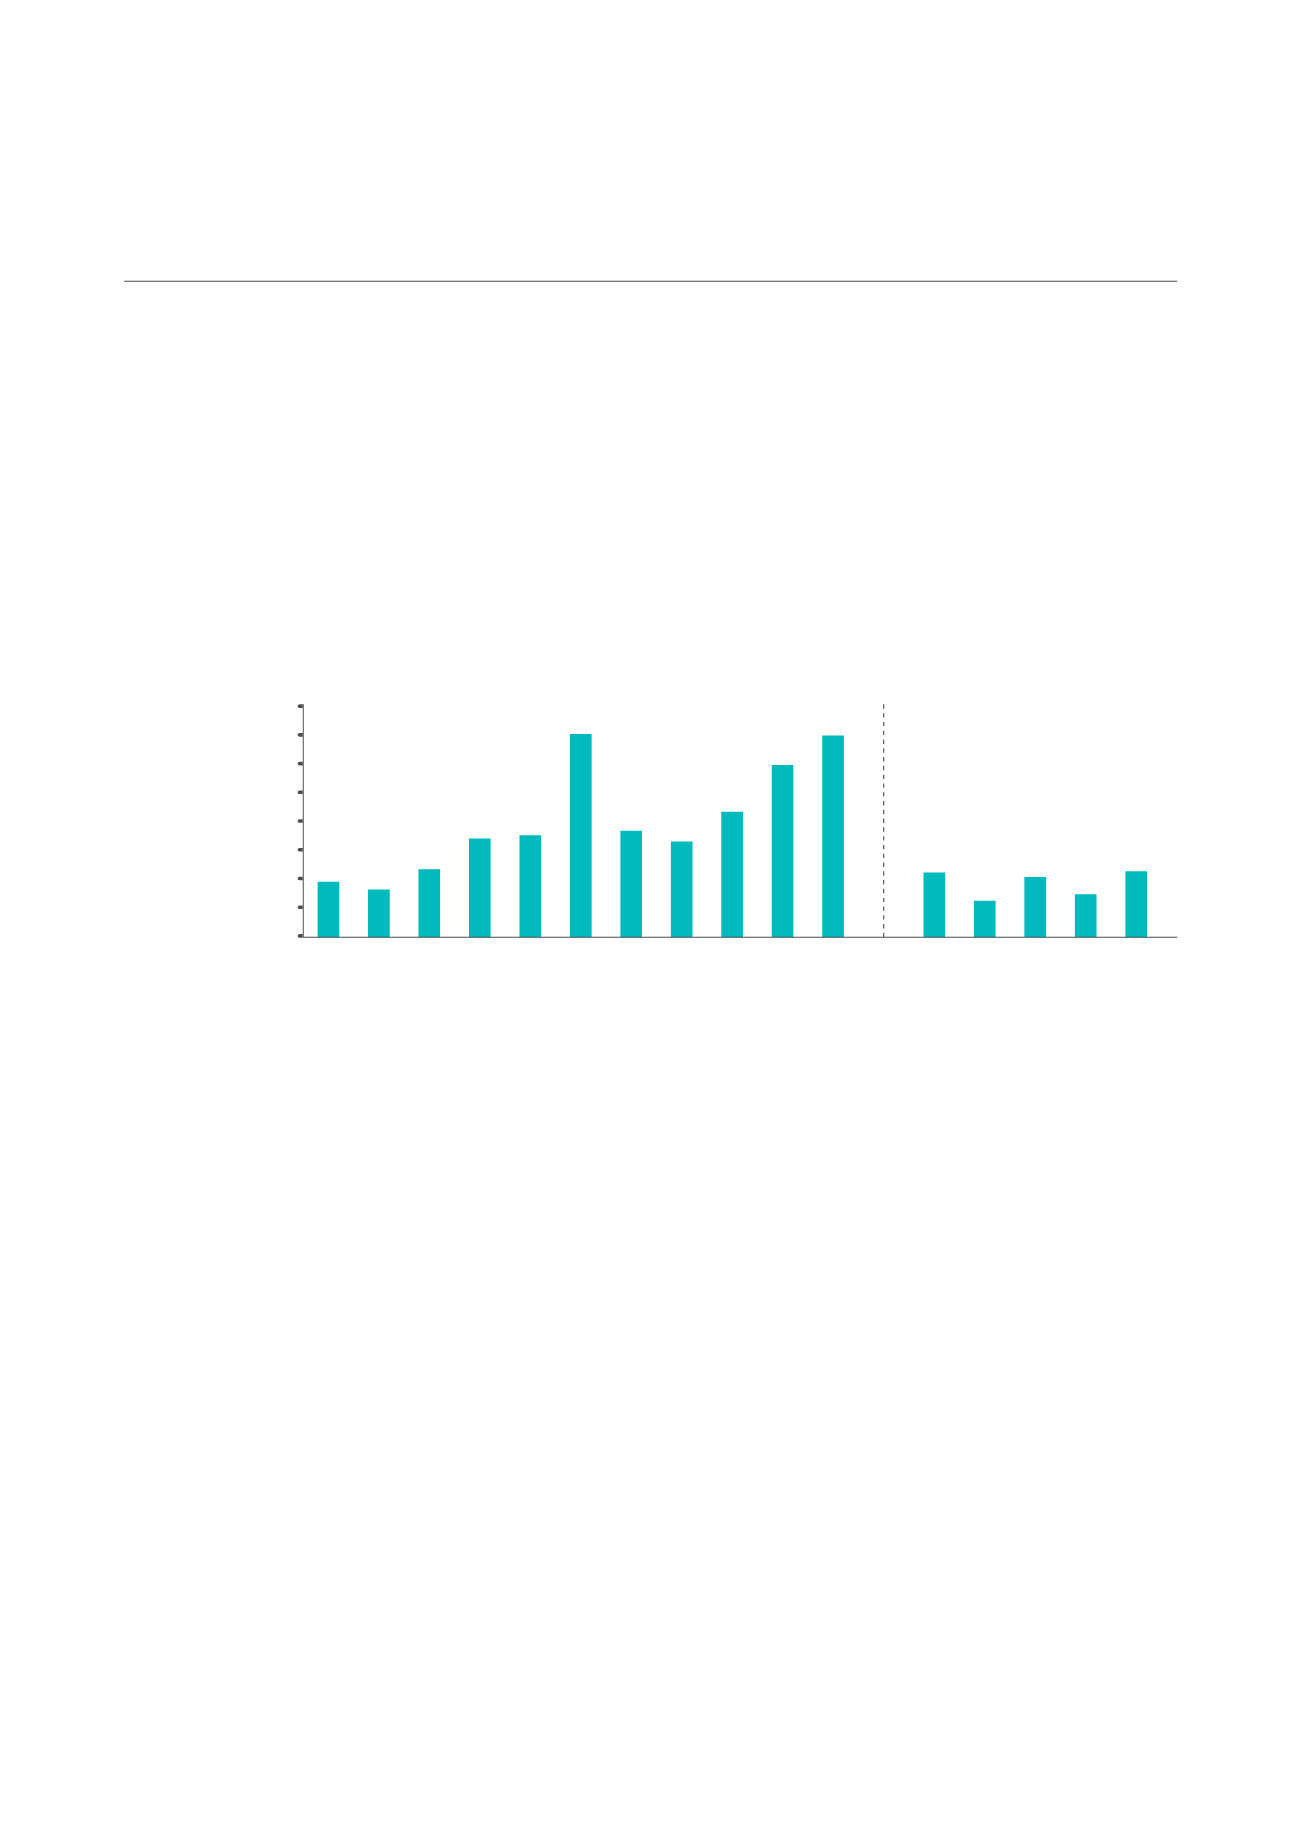
higher. This followed a net increase of 13.8 million sq ft of new factory space (including business park) in 2014,
which was higher than the 11.8 million sq ft added in 2013 and 89.0% higher than the annual average net new
supply
14
of 7.3 million sq ft from 2004 to 2013.
During the year, the business park segment recorded the largest 12.2% YoY increase in stock, followed by the
stock of multi-user factory and single-user factory space which grew by 5.7% YoY and 2.5% YoY, respectively.
NET NEW SUPPLY OF FACTORY (INCLUDING BUSINESS PARK) SPACE
(AS OF 4Q 2014)
2004
2008
2006
2010
2012
2005
2009
2007
2011
2013 2014
4Q14
4Q13 1Q14 2Q14 3Q14
16,000
14,000
12,000
10,000
8,000
6,000
4,000
2,000
0
Net Floor Area ('000 sq ft)
Major new factory completions in 2014 include the partial completion of Fusionopolis Two in one-north with
estimated net lettable area (“NLA”) of about 768,000 sq ft, Premier @ Kaki Bukit at Kaki Bukit Avenue 4 (estimated
NLA of about 686,000 sq ft), Aperia at Kallang Avenue (estimated NLA of about 649,000 sq ft), Microsoft
Operation’s single-user factory at Woodlands Industrial Park E9 (estimated NLA of about 636,000 sq ft) and
Galaxis in one-north (estimated NLA of about 533,000 sq ft).
4.1.2 FUTURE SUPPLY
Based on available information as of 4Q 2014, there are an estimated 43.6 million sq ft
15
(net floor area) of new
factory space (including business park) completing from 2015 to 2018, or an average of 10.9 million sq ft per
annum. Assuming no space will be withdrawn, this is 6.9% higher than the annual average net new supply of
about 10.2 million sq ft for the preceding four years from 2011 to 2014, and 31.3% above the 10-year annual
average supply of 8.3 million sq ft from 2005 to 2014.
The majority 44.9% (19.6 million sq ft) of the new upcoming supply is expected to be completed in 2015.
Thereafter, the potential supply is forecasted to moderate to 15.1 million sq ft in 2016, 6.2 million sq ft in 2017
and 2.7 million sq ft in 2018.
By type of factory, 54.9% of the total new factory space supply from 2015 to 2018 is estimated to be single-user
factories, and 36.1% are expected to be multi-user factory space. The remaining 9.0% is expected to be new
business park space.
CAMBRIDGE INDUSTRIAL TRUST | A WINNING FORMULA
83


