Examples of Major* Known Potential Supply of Warehouse Space from 2015 to 2018
(As of 4Q 2014)
Project Name
Location
Developer
Estimated
Net Lettable
Area (sq ft)
Expected Year
of Completion
(TOP)
Single-User Warehouse
Warehouse
Gul Circle
Crystal Freight Services
Distripark Pte Ltd
928,102
2016
Supply Chain City Jurong West Avenue 2/
Jurong West Street 23
Supply Chain City Pte Ltd
(YCH Group)
1,335,886 2016
Warehouse
Pandan Road
Poh Tiong Choon
Logistics Limited
1,038,216 2018
Multi-User Warehouse
Space @ Tampines 18 Tampines Industrial
Crescent
Oxley Bliss Pte Ltd
602,574
2015
Warehouse
5B Toh Guan Road East Mapletree Logistics Trust
Management Ltd
580,799
2016
Carros Centre
60 Jalan Lam Huat
Kranji Development
Pte Ltd
991,420
2017
* refers to projects with an estimated net lettable area of at least 500,000 sq ft
Source: JTC/Colliers International Singapore Research
5.2 DEMAND AND OCCUPANCY
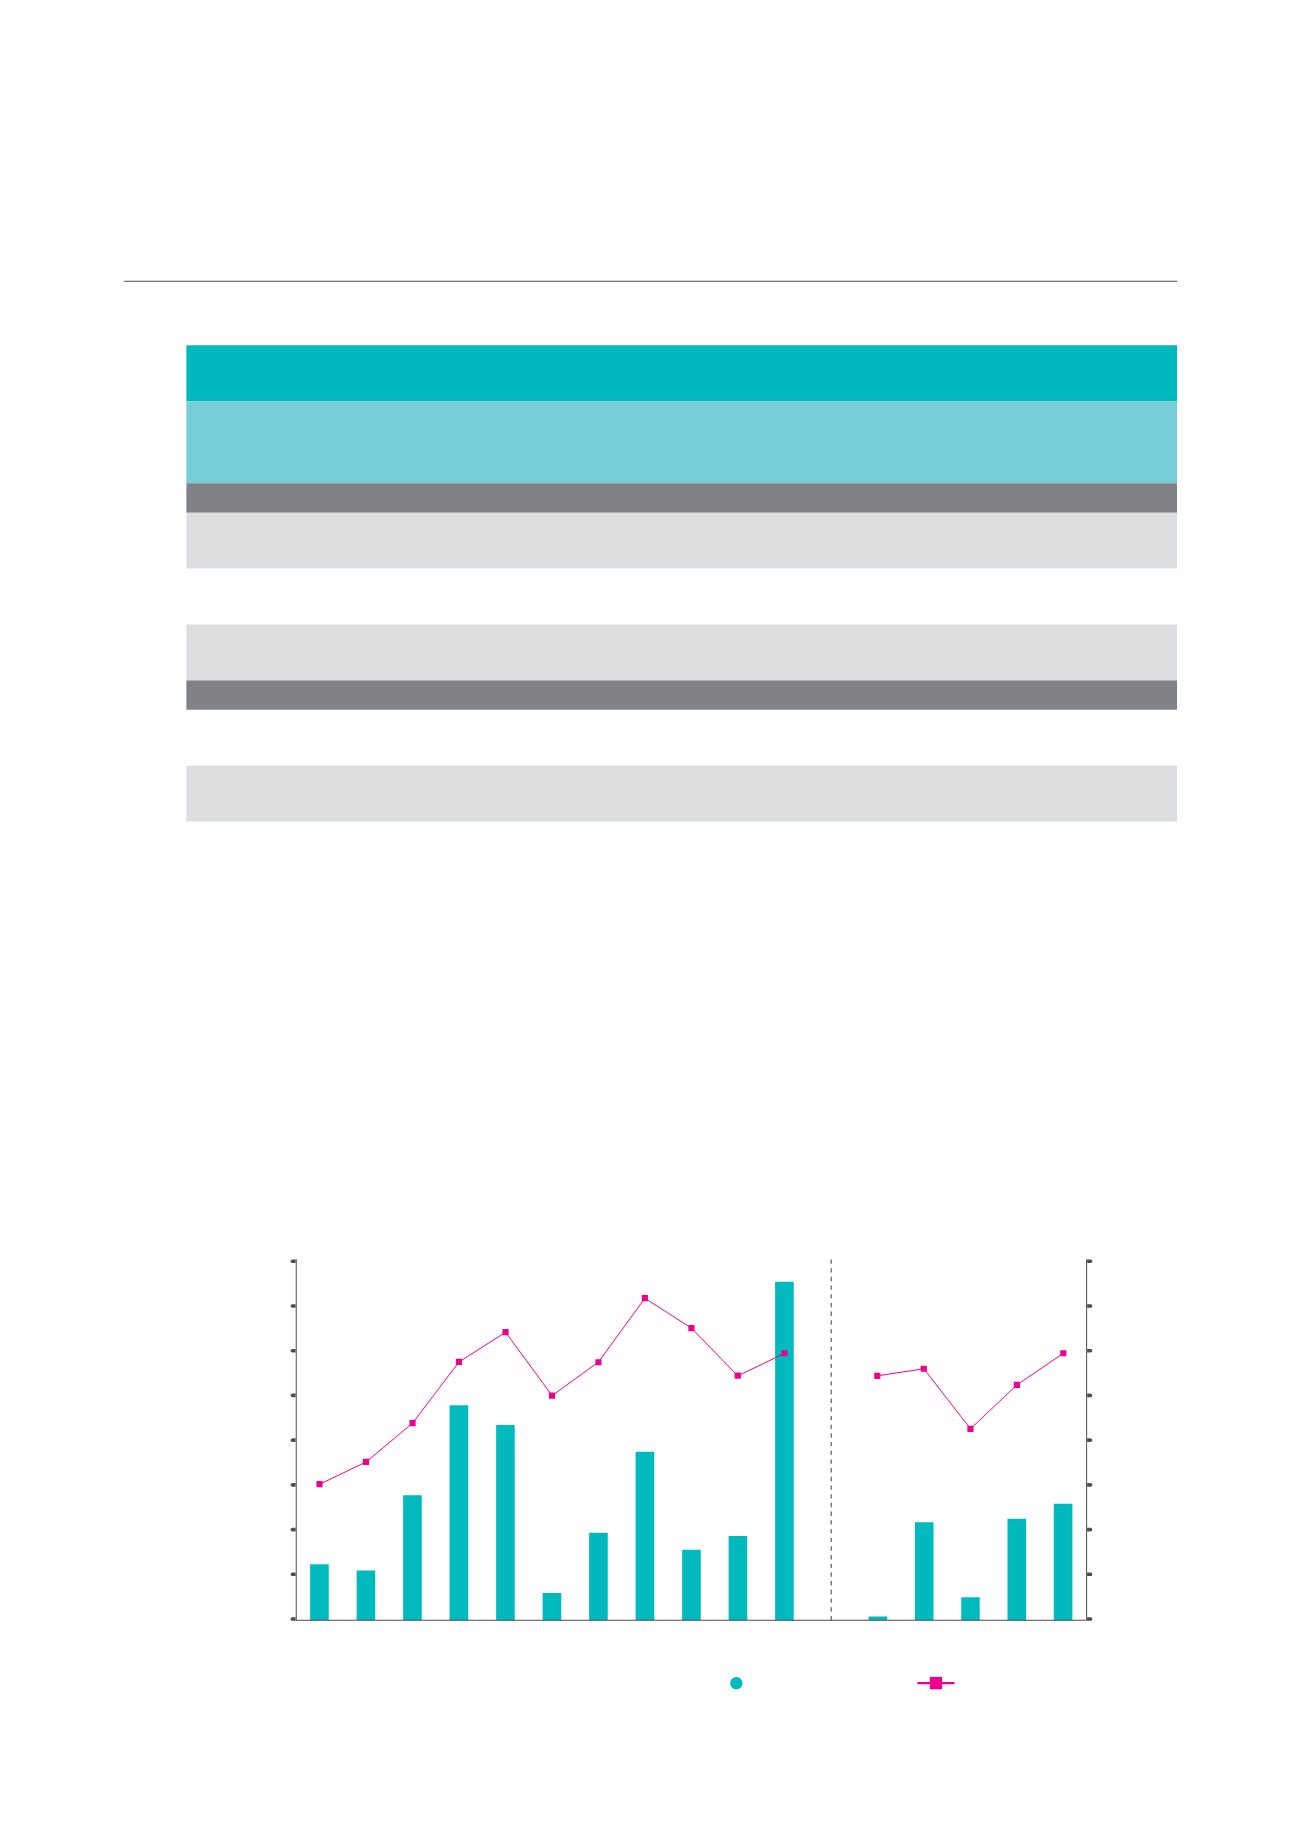
Net new demand of warehouse space surged 303.5% YoY to a historical high of 7.5 million sq ft in 2014, compared
to an average annual net new demand of 2.4 million sq ft from 2004 to 2013. As overall net absorption exceeded
the corresponding net new supply of 7.3 million sq ft in 2014, the average occupancy rate improved from 90.8%
as of 4Q 2013, to 91.8% as of 4Q 2014.
NET NEW DEMAND AND AVERAGE OCCUPANCY RATE OF WAREHOUSE SPACE
(As of 4Q 2014)
2004
2008
2006
2010
2012
2005
2009
2007
2011
2013 2014
4Q13 1Q14 2Q14 3Q14 4Q14
1,000
2,000
3,000
4,000
5,000
6,000
7,000
8,000
96%
94%
92%
90%
88%
86%
84%
82%
80%
0
Net Floor Area ('000 sq ft)
Occupancy Rate
Source: JTC/Colliers International Singapore Research
Net New Demand
Occupancy Rate
CAMBRIDGE INDUSTRIAL TRUST | A WINNING FORMULA
93


